BP Biogas renewables
Portfolio Optimization & Trading platform
PROJECT
Trading platform
Modelling dashboard
Data visualisation
ROLE
Product Design Lead
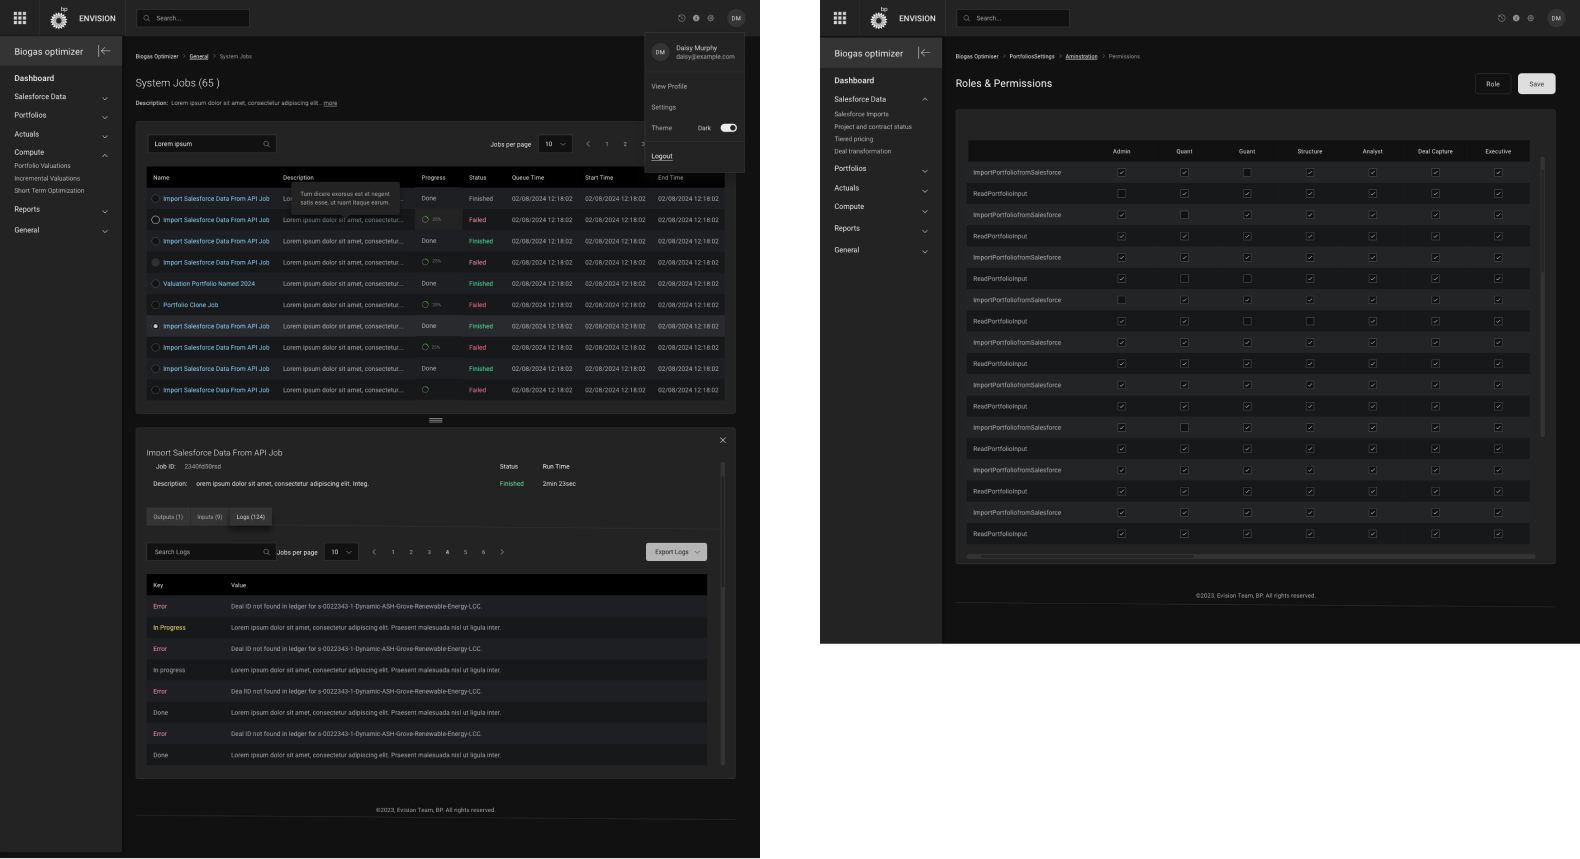
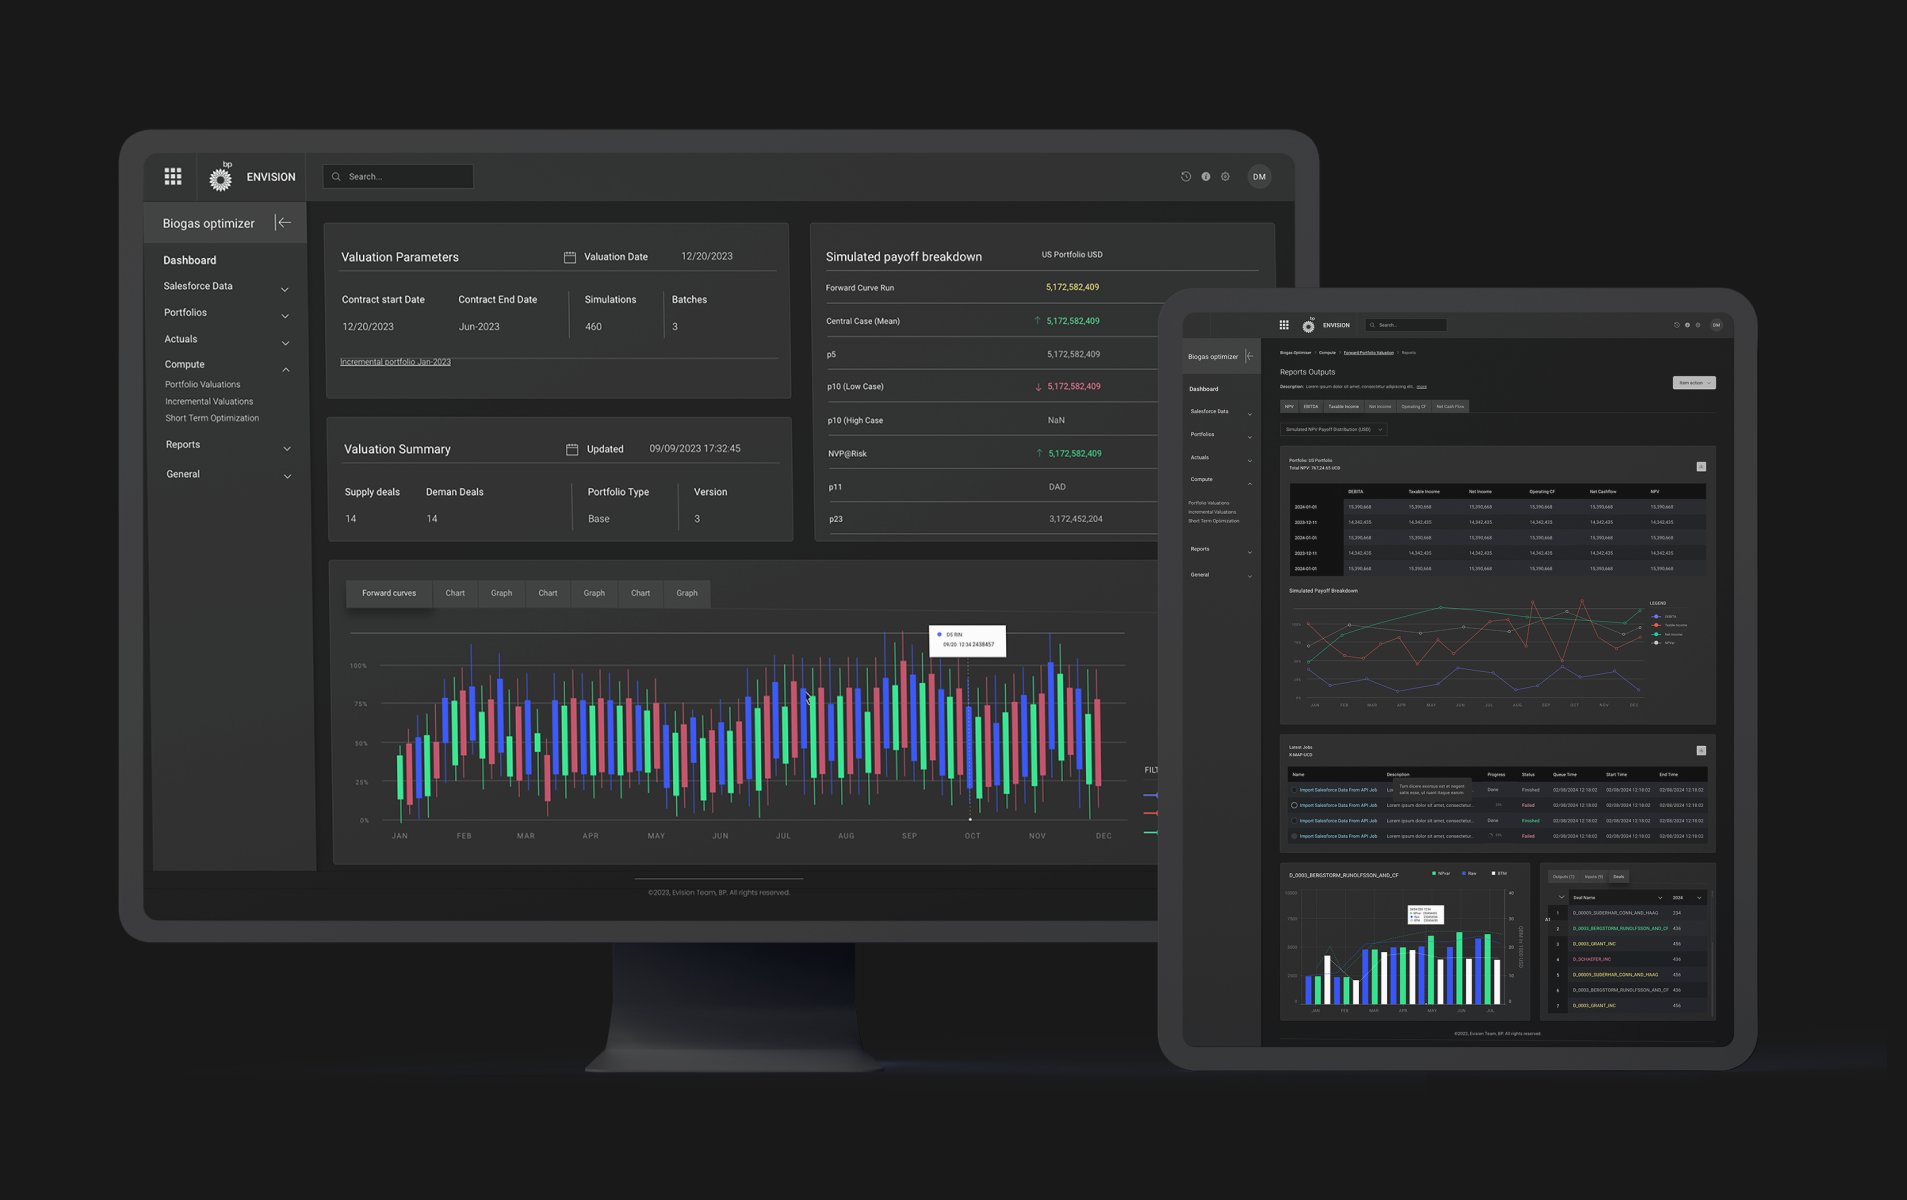
Portfolio Optimization Model, a B2B Biogas investment and trading platform/dashboard, to strengthen BP's competitive advantage in renewables deals and trading.
A platform that allows users to easily run complex quantitative modelling to optemise renewables trade deals, structures, and overall return on transactions.
Background
bp's biogas business needs a tool that can take inputs of multiple parameters covering all aspects of a biogas deal and inform the business of the optimal structure.
This needs to account for optimal pathway allocation (getting biogas from point A to point B!) as well as contractual flexibility and other deal parameters.
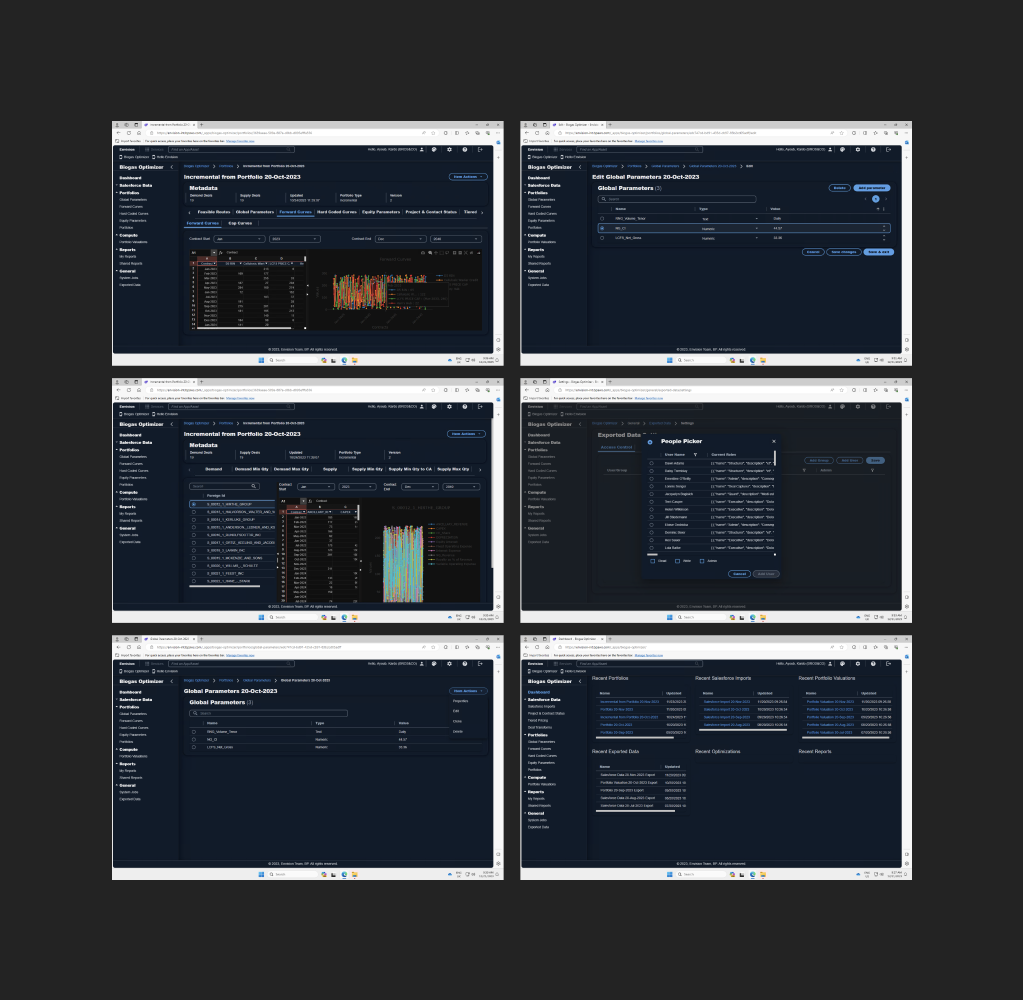
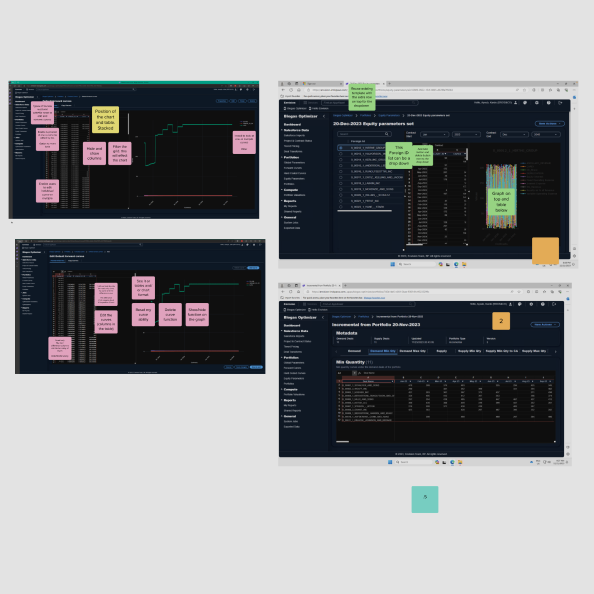
The business currently has a python-enhanced excel spreadsheet that does this for the business. But it is very difficult to use.
We need to preserve the powerful functionality on a platform that is scalable, resilient, and user-friendly.
Role & approach
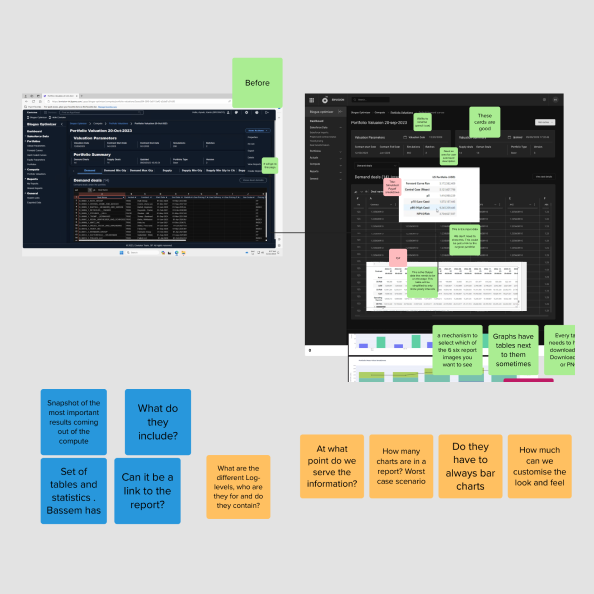
As the lead product designer, I was brought in to design a product that had been in the making for over a year. So first I had to go back and see what had been done and who had been involved so far.
I was trying to see what the design process had been and realised that not much was documented, and things could’ve been done in isolation from one another.
So, my approach was to bring everyone together in a few sessions to review the lay of the land and what was done so far.
1.0 Requirments gathering
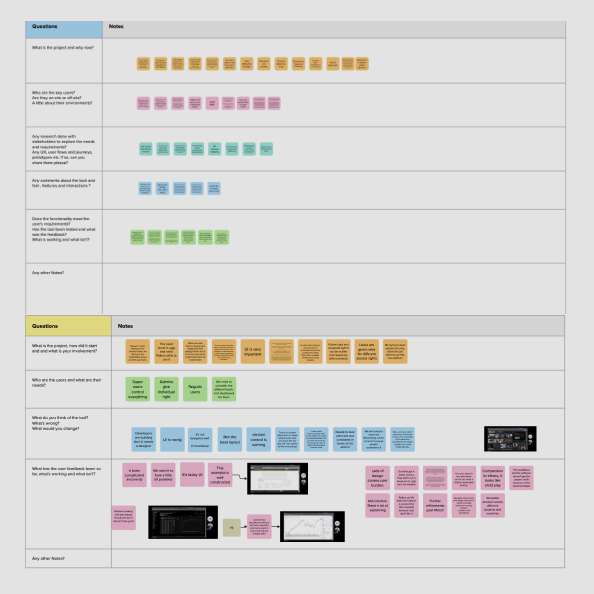
I started by engaging with the stakeholders, users, data scientists, and developers involved in the project.
They largely aligned on the purpose of this tool but there were a lot of gaps in the process they had been through and many design steps had been overlooked.
So far, the project had been led by engineers working directly with the business not going through a proper design process. They were translating a manual process directly into a digital product without considering user behaviours, UX patterns, and flows.
Features and functionalities were added on an ad-hoc basis. sketching, prototyping, and testing were also non-existent.
Business insight
The business needs a tool that can replace Excel and Python code to expand the user group and open up these capabilities to a wider audience.
Having only one person knowing how to use the tool is risky for the business.
User insight
Most users who could benefit from this tool don't have Python coding skills, and rely on one person each time they need to run a calculation.
They need a digital tool to be able to perform their tasks easily and independently.
Experience vision
The biogas business needs to preserve the powerful functionality while moving it onto a platform that is scalable, resilient, simple, and user-friendly.
Users need the ability to run complex models through a user-friendly and intuitive interface.
2.0 Definition & vision
I made sure that design became a key part of the project team, and the correct design processes were followed during our sprints.
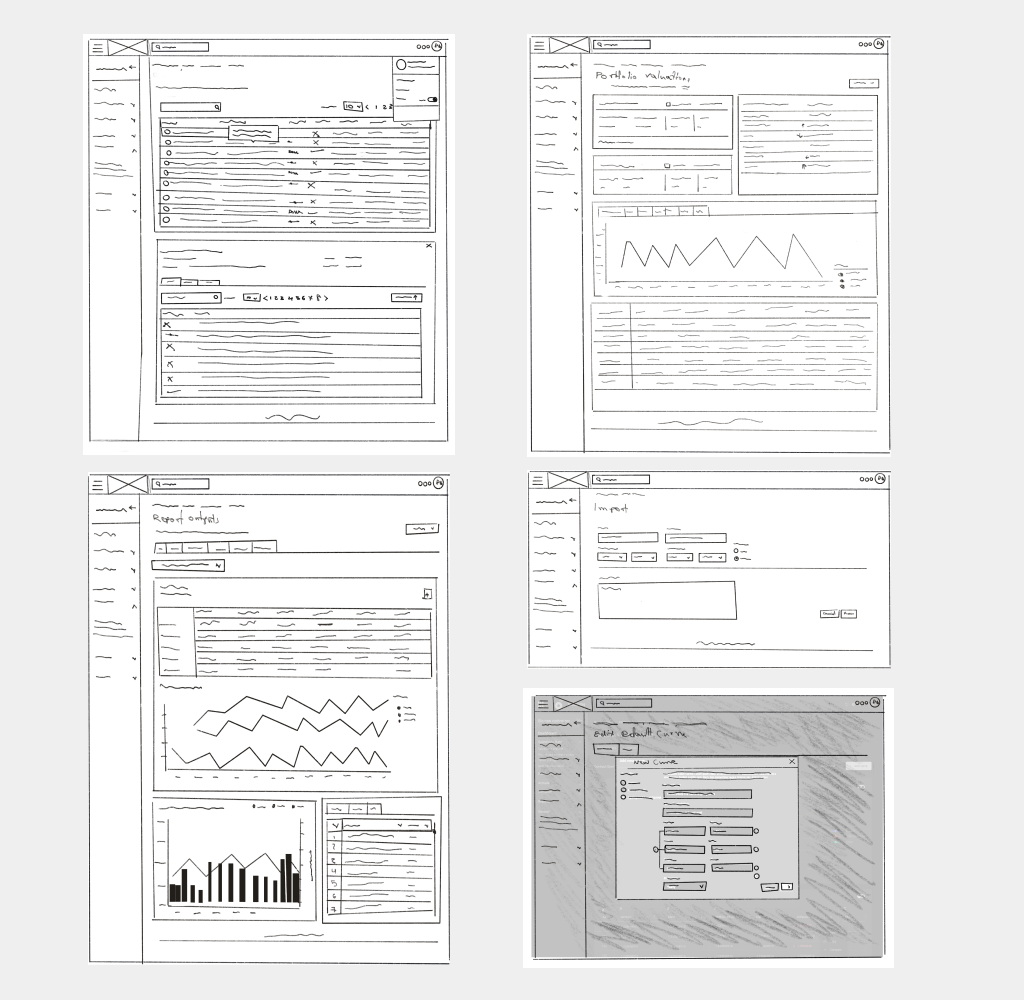
Gathering requirments via user interviews and feedback and going through a cyclical design process from ideas through to sketching, prototyping, and testing before committing to development.
The team quickly saw the value of design thinking and realised it was a much better, and efficient way of working rather than developing features without involving users and designers first.
3.0 Design execution
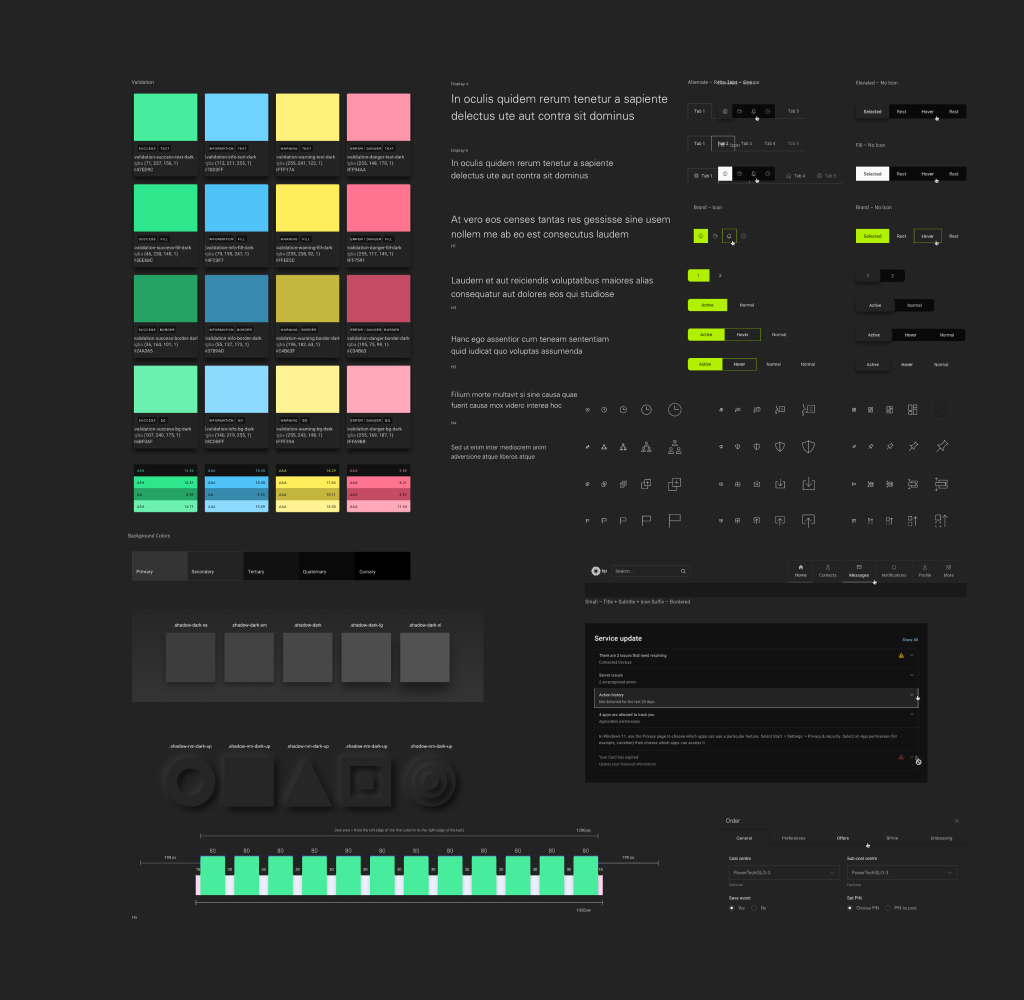
I have built, and worked with, many design systems and component libraries before, but none has been so vast, thorough, and well documented as BP-Core which has over 75000 UI elements and components giving you pretty much everything.
The system is well built to aid and not restrict creativity whilst speeding up the design process, and improving usability, accessibility, and consistency.
I have learned a lot from its setup, content types, architecture, and how to structure such a vast design system.
Using it we were able to design templates, test, and iterate quickly before handing designs over to engineers.
